Data We Can Touch: DHMakes and LEGO Visualization at Semester's End
As the semester draws to a close, we find ourselves collectively exhausted and racing to the finish line. Rather than pile on more theoretical concepts during this final push, I hosted a hands-on DHmakes session focused on the physicalization of data—offering a creative and fun conclusion to our Foundations in Digital Humanities course before final presentations.
For this class, I deliberately paired minimal pedagogy with low-tech approaches and DHmakes principles—creating a learning environment that emphasized experimentation, tactile engagement, and accessible tools rather than complex digital platforms. This combination allowed students to focus on creativity while lightening the cognitive load during this demanding time of the semester. I can see it on their faces.
The session drew inspiration from brilliant DHMakes practitioners whose work has illuminated our learning journey throughout the year: Pam, Quinn, Claudia, Alex, Amanda, Ryan, and many others who ingeniously blend craft with data visualization and share their creations under the #DHmakes hashtag on social media.
From Dissertation to Physical Network
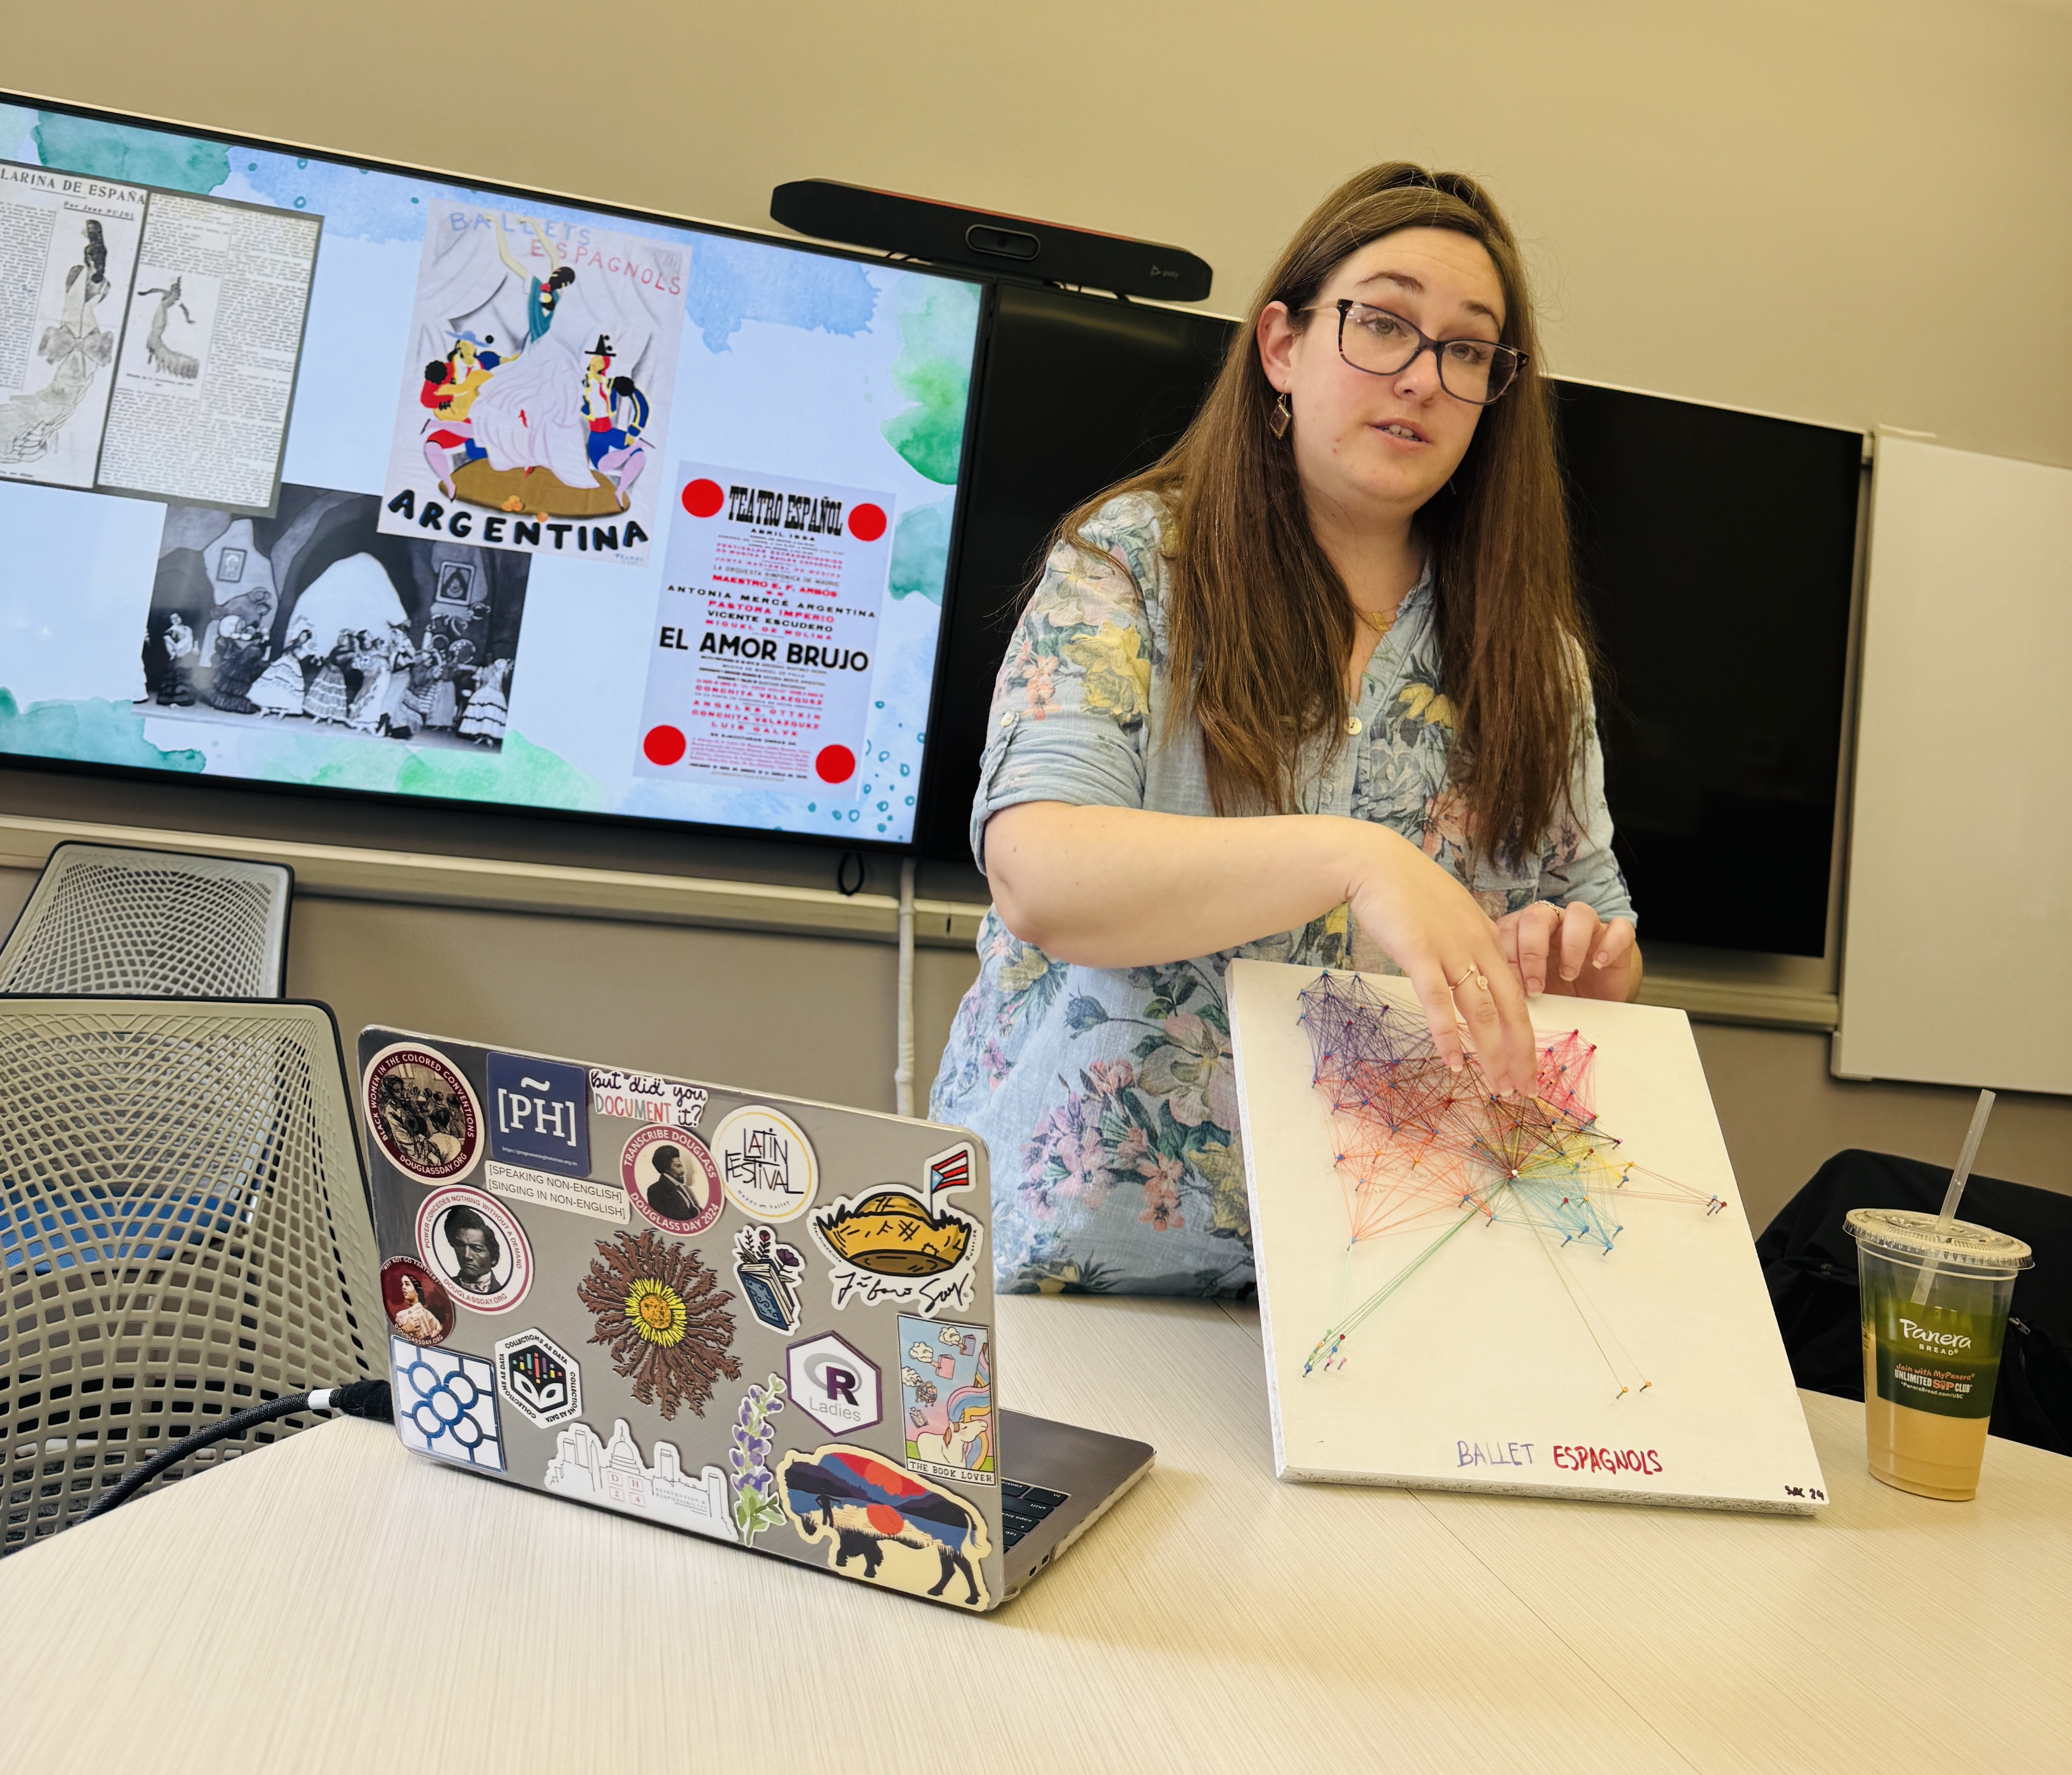
We kicked off with a guest presentation by Dr. Sara Arribas Colmenar, who recently defended her dissertation. She showcased her physical network visualization project, walking us through her conceptual framework, methodological choices, DIY execution, and representational decisions. Her piece—created with wood, nails, floss, and paint during her summer research time in Spain, adapting a regular string art class—demonstrated what DHMakes can be at its best. She drew on the Making Research Tactile: Critical Making and Data Physicalization in Digital Humanities Special Issue of DH+Lib to showcase what DHMakes is, but explained how crafting a tangible representation of her digital networks actually improved her color choices in Gephi, basing her choices on accessibility for colorblindness.
Two insights from Sara’s presentation resonated deeply with students:
- Creating tangible representations of digital data can deepen our understanding of methods, algorithms, and visualizations beyond what’s possible in purely digital forms.
- DHMakes provides a way to momentarily “unplug” from traditional academic work through physical embodiment, even while advancing scholarship.
LEGOs as Data Visualization Tools
For the hands-on portion, I brought a small dataset capturing distances (in both miles and minutes) from our campus’s Old Main building to other important locations: the Stadium, Library, Ice-Cream store, and more. Then I introduced our medium for the day: LEGO bricks.
Among countless approaches to physical data representation beautifully illustrated in Data@Urban’s article “Bringing Data to Life”, LEGO offered a playful yet structured way to represent our academic environment—not just through architectural structures but by including the people who bring these spaces to life.
We initially tried using one 1×1 brick per 4 minutes of travel time, but soon realized this wouldn’t give us enough granularity on the 32x32 plate we were using. All was packed together! So we pivoted to using one 1×1 brick per minute, with 4 being the minimum (nearest location) and 26 the maximum (to the Stadium).
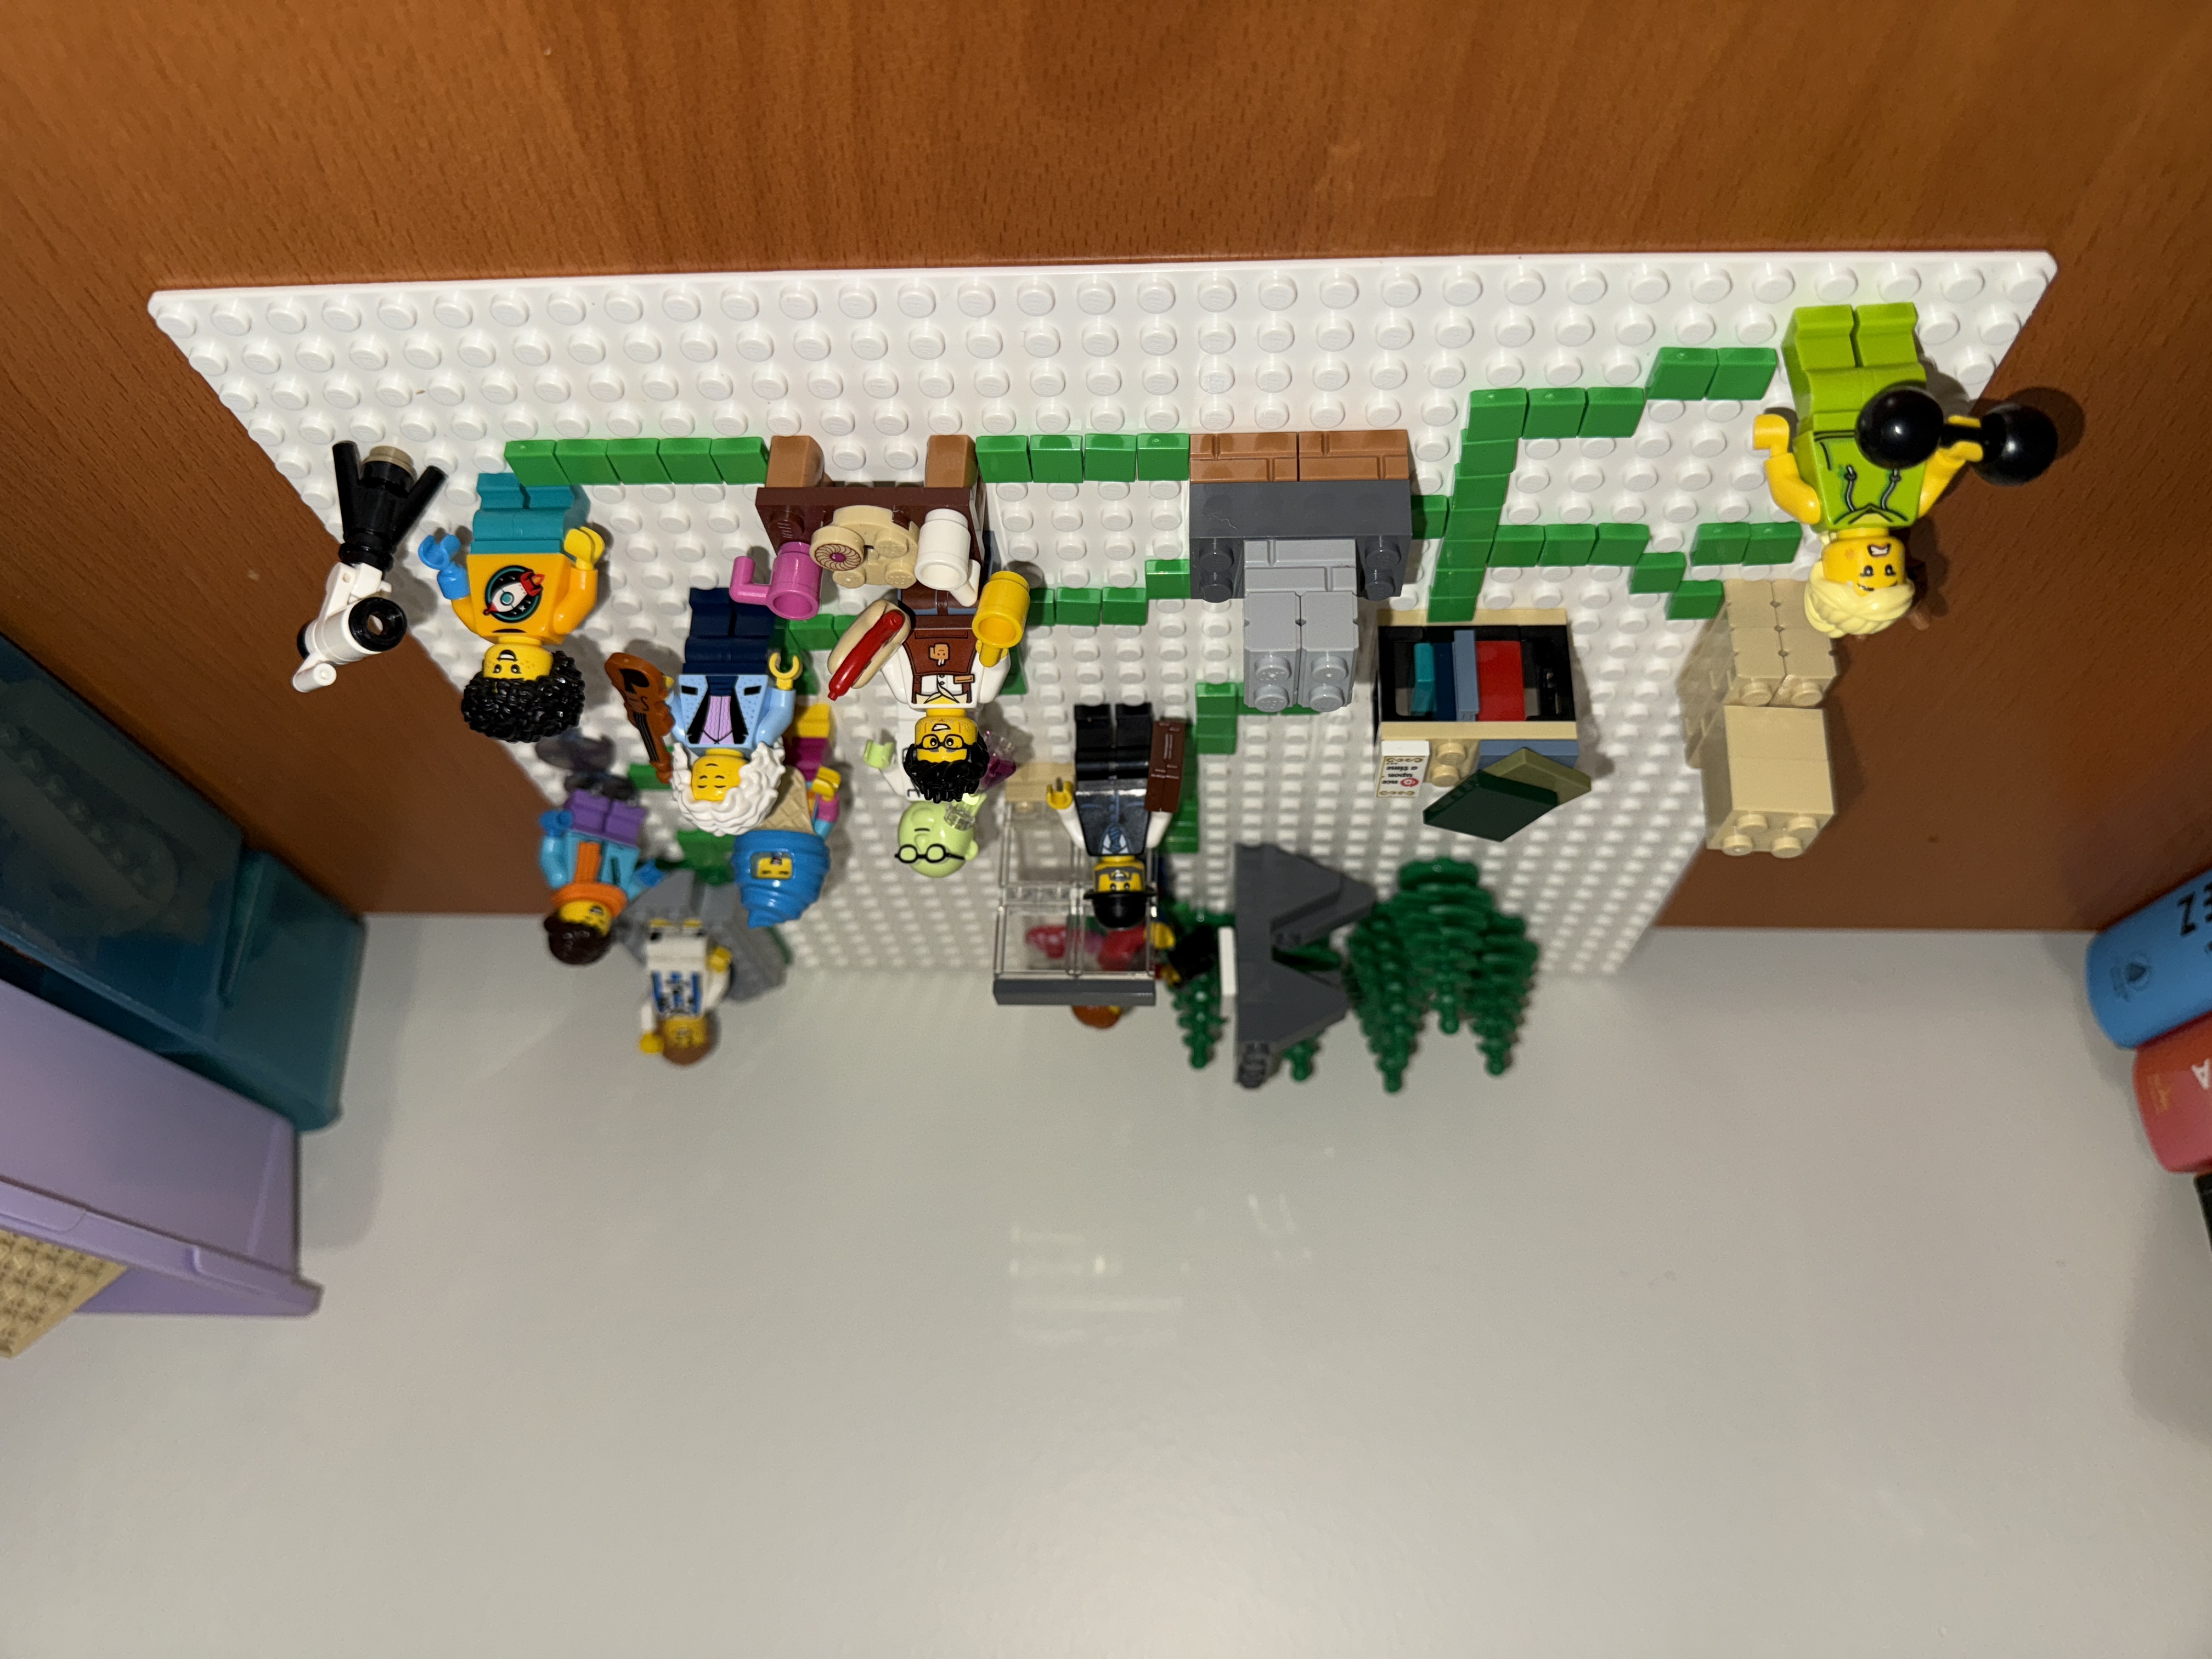
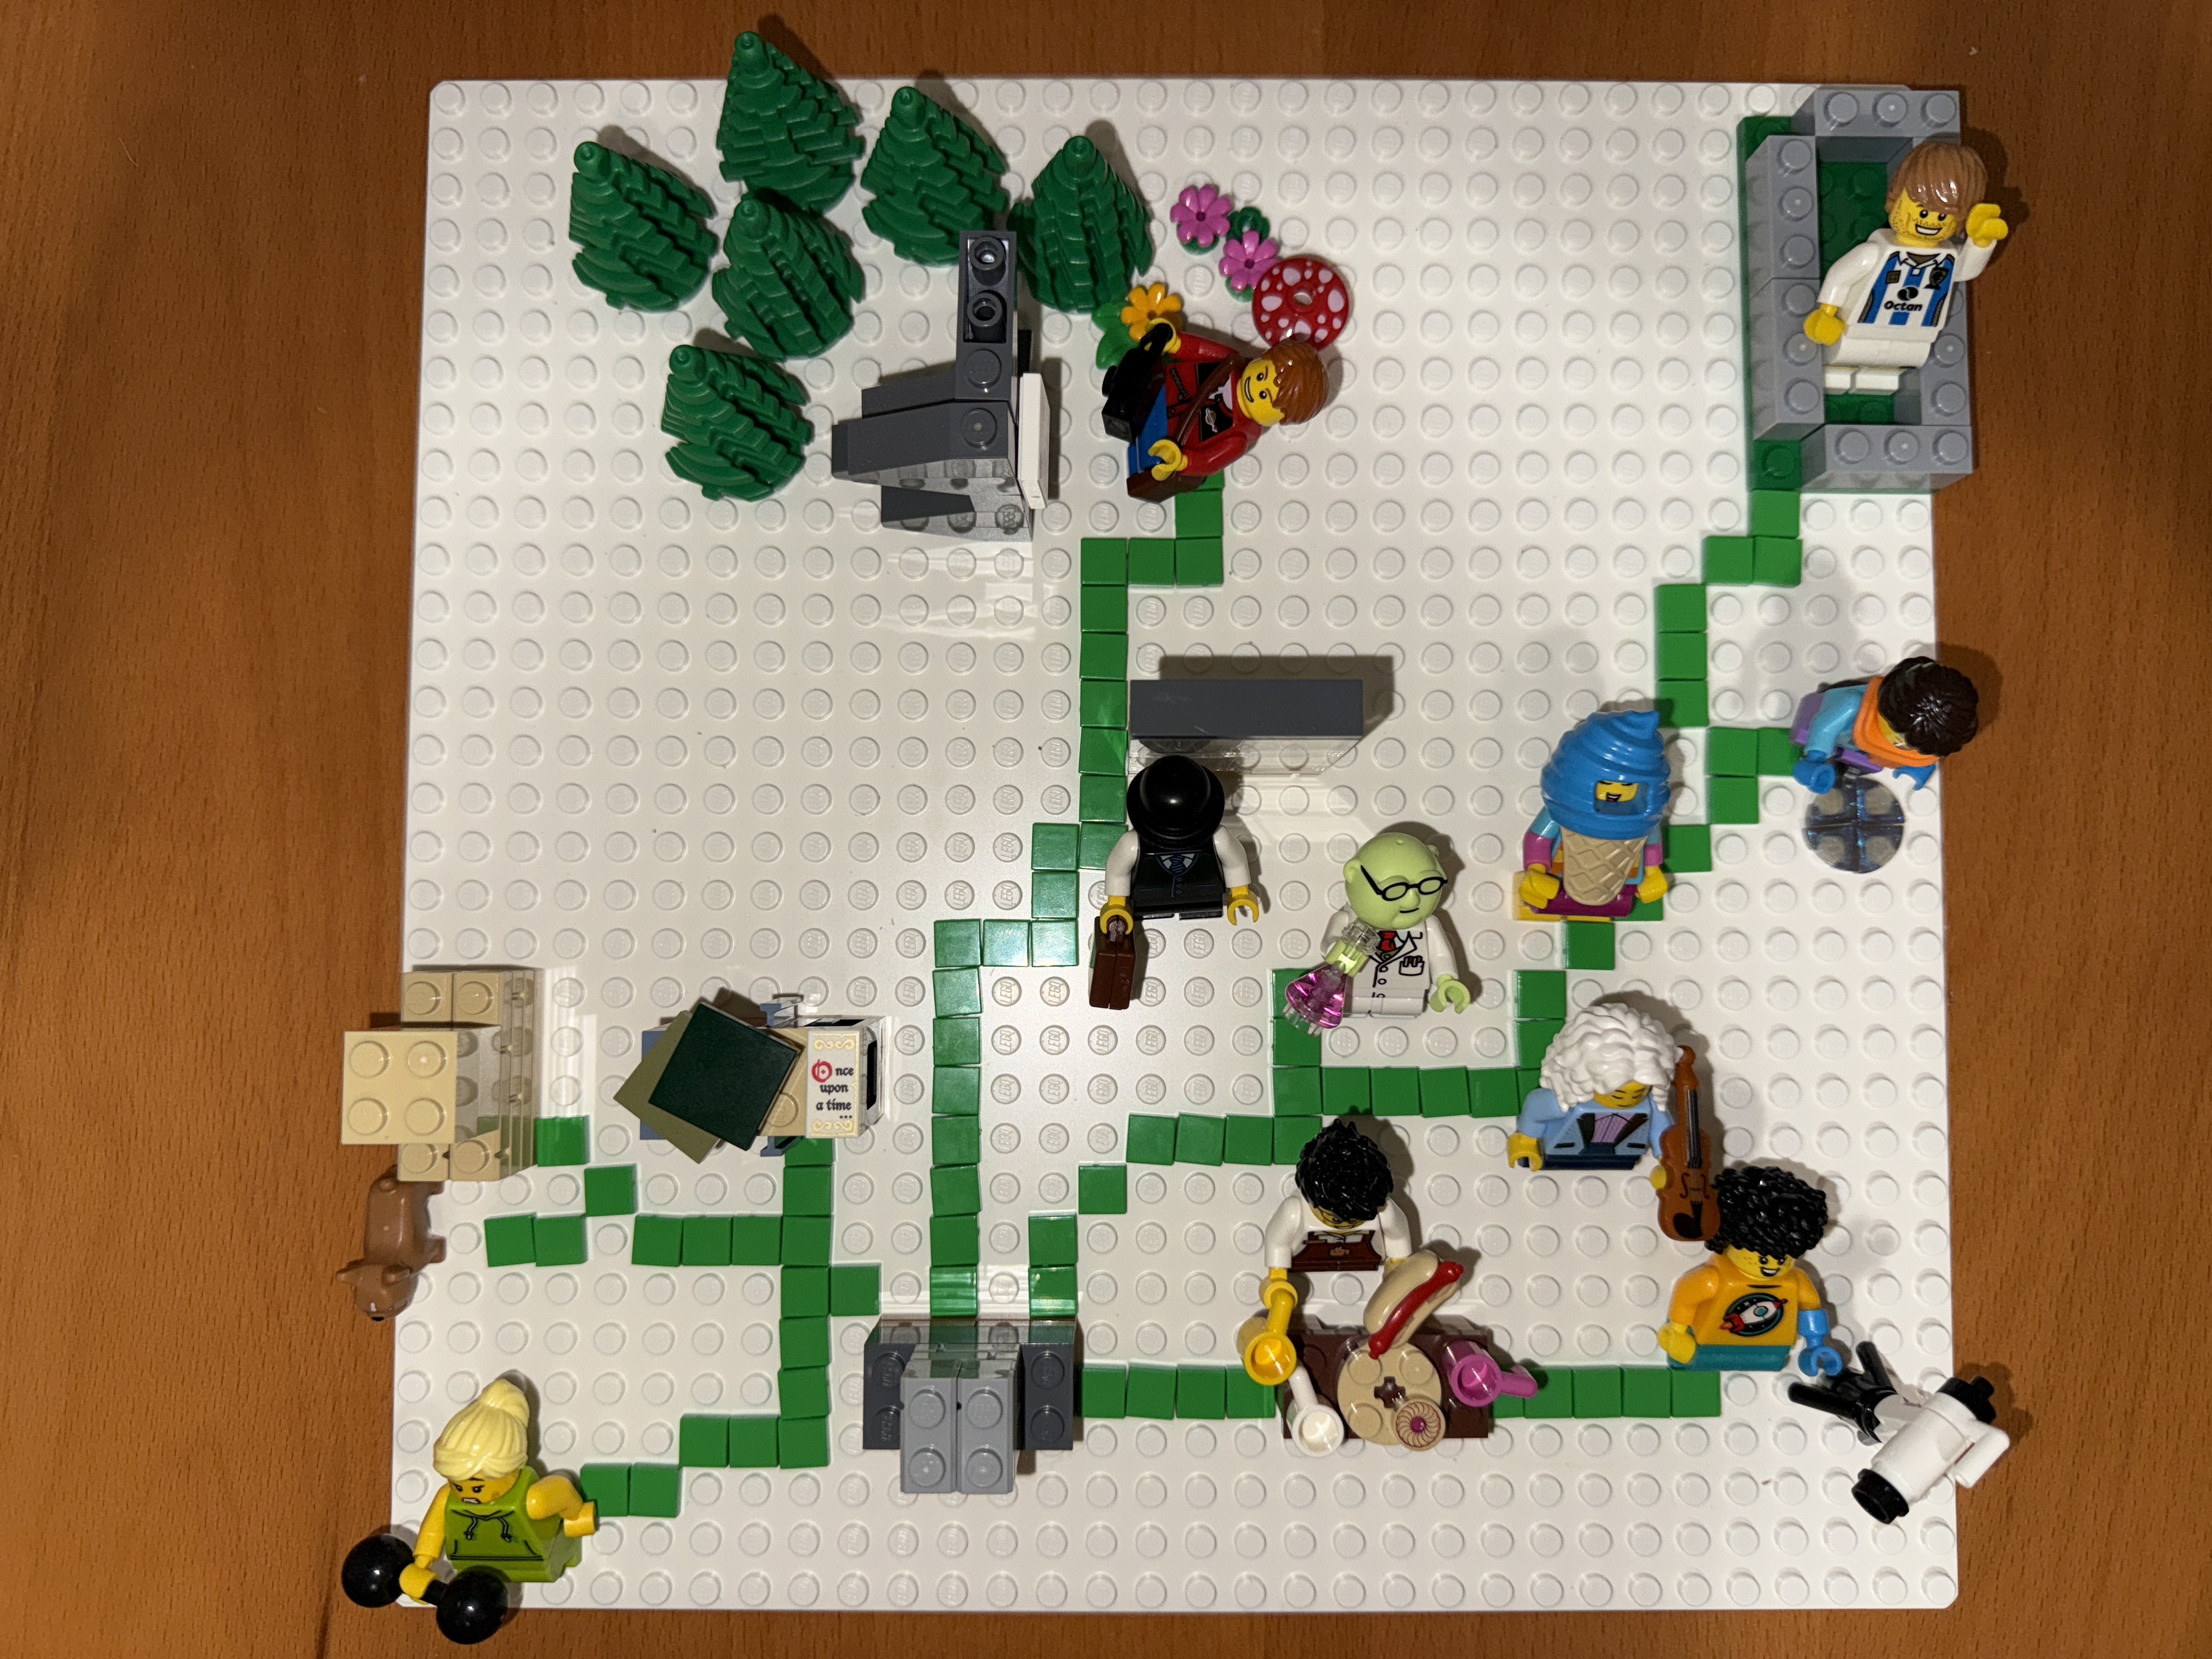
The resulting visualization was creative—perhaps a bit chaotic—but sparked a fascinating discussion and we have some laughs that we need right now. One student envisioned using LEGO bricks to teach spatial navigation, noting how students often lose their orientation when viewing spaces only through digital representations. Another one suggested it would be great to pick a Lego person and record it “walking” around campus to those locations, creating a video to pair up with the physical visualization we already had and asked: Is that DH?!
Beyond the Classroom
Our session evolved into a broader conversation about the importance of having hobbies during graduate school (and beyond!) that may or may not connect to research interests. If nothing else, the session demonstrated that incorporating play into academic work isn’t frivolous—returning to embodied activities, physical data representation, and tactile creativity offers valuable ways to learn, explore, teach, and innovate.
In these final, pressure-filled weeks of the semester, our LEGO data visualization session provided not just a break from routine, but a reminder that digital humanities thrives when we connect the digital back to the human—hands, minds, and all.